About Visual Perception
Most people tend to think of vision as information that is transferred from the eyes to the brain where a picture is “seen”. However a significant part of the brain is devoted to higher visual processing that helps us to interpret the pictures that we see and guide our responses.
 In the case of dyslexia it is well known that the vast majority of students have normal eyesight (ie. 20/20 vision) but what about their higher visual processing? Like eye tracking, the issue of whether or not higher visual processing affects learning has been the subject of much debate. This discussion will consider three areas of visual perception: 1) Visual Span 2) Visual Counting 3) Visual Spatial
Visual Span Visual span is a measure of our “window of attention” or how far out to the side we can process visual information per look. In some studies this is taken to mean the amount of information that can be taken in per look (eg. the number of letters that can be seen in a string of letters) whilst in other studies it simply means the distance that letters can be seen from a central fixation target. A “look” is generally considered to be around a tenth of a second so that the observer is unable to make multiple eye movements. An example of measuring visual span might be looking at a central target such as a star followed by some numbers (or letters) that are flashed to either side of the star. As the numbers are flashed further apart the task becomes more difficult until the limit of the observers visual span is reached.
For numbers and letters, the visual span is affected by a various factors such as the font size (in children under 8), the contrast, the surrounding material, and the spacing between characters (ie. crowding effects). Although the visual span is also limited by our ability to resolve detail in the periphery it is more profoundly affected by crowding. That is to say, if letters are flanked on either side of the stimulus (letter or number) then the visual span is reduced by a factor of four from about 18 characters to 4.5 characters from fixation.
Visual span can be considered as a “simultaneous” visual processing task since the characters are presented as a single flash, as opposed to a “sequential” processing task. There is evidence to show that dyslexics may exhibit a simultaneous processing deficit.1 A reduced visual span means that a student sees less information to the side per look which results in them having to make more eye movements and slower reading speeds. Indeed it has been shown that a reduced visual span creates a bottleneck to reading speed.2 Data collected on both British and French children demonstrate that students with developmental dyslexia often have a reduced visual span compared to non-dyslexic children.3 Both phonological awareness (a common linguistic measure of dyslexia) and visual span were shown to be strong predictors of reading performance and a number of participants (23.1%) exhibited a visual span deficit with no phonological deficit at all. Such studies support the role of a visual perceptual deficit and affirm the view that developmental delays are multi-factorial in nature, not solely caused by impaired phonological skills.4,5,6
Most importantly, visual span can be improved with training and results in increased reading speeds of around 40 to 60%.7,8 Of particular interest such improvements in the visual span are transferable to different locations in the visual field (eg. from the lower to upper field and vice versa) and also from the print size used to other print size. One training method used to improve the visual span involves using a trigram letter recognition task (ie. where the subject has to identify the middle letter in a group of three letters presented to one side of fixation) which raises the question of whether subjects are merely learning to better identify crowded letters. Training to improve the crowding effect however has been shown to have minimal affect on reading speed.9 This is not to say that reducing crowding would not be helpful for dyslexics, but rather that improving this capacity is not the reason why the visual span improves.
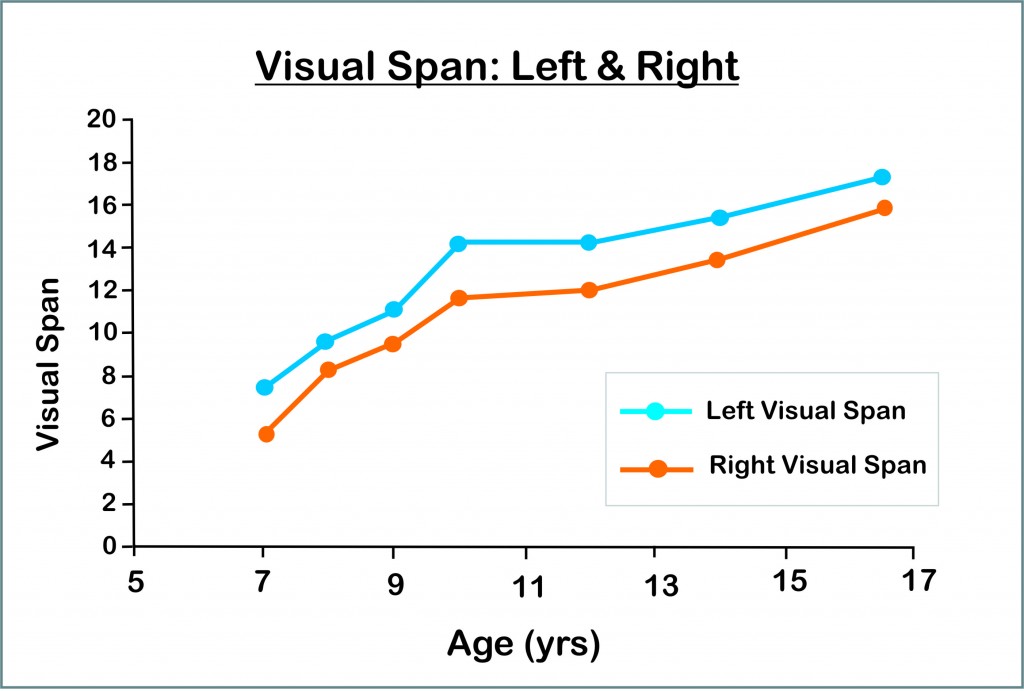
This iCept test of visual span is unique in that it uses single digits presented simultaneously on either side of fixation (see picture above). This is in contrast to the Trigram method described above or the Form Resolving Field (FRF) which measures single letter recognition in the periphery with the presentations being made on one side of fixation only. In the case of the FRF dyslexics are the same or better than normal readers and no significant difference is found to exist between young readers and adult readers.10 For the Trigram method however the visual span increases throughout the school years and tapers off with adulthood paralleling the growth in reading speed that is known to occur in students.11 This is very similar to the iCept test findings which show a significant difference between school aged children, with older children having nearly three times the visual span of younger children (see below). A common feature in both these methods is that they require students to process more than one letter or number in the periphery (ie. process visual symbols in parallel) which places a higher demand on visual attention.
It is worth noting that the visual span differs from the “perceptual span” which is the span measured whilst reading. Unlike the visual span the perceptual span is much larger to the right than the left. The visual span measured on iCept however is larger to the left. This phenomenon has previously been observed by other investigators who found that attention to the left visual field is more accurate compared to the right visual field for both American college students and Israeli students (who scan from right to left).12
Since it can be shown that improvements in reading speed due to increased visual span are not attributed to crowding9, spatial attention8 or memory13 it is argued that the improvements must be due to the ability to more rapidly process simultaneous information in the periphery – something which dyslexics are probably worse at compared to good readers (or younger children compared to older children). This ability does not depend on langauge and is consistent with a Magnocellular deficit.
REFERENCES
1. Lassus-Sangosse D, N’quyen-Morel M, Valdois S. Sequential or simultaneous processing deficit in developmental dyslexia? Vision Res 2008, 48(8):979-988.
2. Legge GE, Cheung S, Yu D, Chung ST, Lee H, Owens DP. The case for the visual span as a sensory bottleneck in reading. J Vis 2007;7(2):911-915.
3. Bosse M, Tainturier M, Valdois S. Developmental dyslexia: The visual attention span deficit hypothesis. Cognition 2007, 104(2):198-230
4. Bosse M, Vladois S. Influence of the visual attention span on child reading performance: a cross sectional study. Journal of Research in Reading 2009, 32(2):230-253
5. Mesman G, Kibby M. An examinationof multiple predictors of orthographic functioning. J Learn Disabil 2011, 44(1):50-62.
6. Menghini D, Benassi M, Bolzani R, Facoetti A, Giovagnoli S, Ruffino M, Vicari S. Different underlying neurocognitive deficits in developmental dyslexia: A comparative study. Neuropsychologia 2010, 48(4):863-872.
7. Chung ST, Legge GE, Cheung SH. Letter-recognition and reading speed in peripheral vision benefit from perceptual learning. Vision Res 2004, 44(7):695-709.
8. Lee H, Kwon M, Legge G, Gefroh J. Training improves reading speed in peripheral vision: Is it due to attention? Vision Res 2010, 50(9):860-869.
9. Chung S. Learning to identify crowded letters: Does it improve reading speed? Vision Res 2007, 47(25):3150-3159.
10. Zegarra-Moran O, Geiger G. “Visual recognition in the peripheral field: letters versus symbols and adults versus children” Perception 1993; 22(1) 77 – 90.
11. Kwon M, Legge G, Dubbels B. Developmental changes in the visual span for reading. Vision Res 2007, 47:2889-2900.
12. Braine L. Asymmetries of pattern perception observed in Israelis. Neuropsychologia 1968, 6(1):73-88.
13. Lobier M, Dubois M, Valdois S. The Role of Visual Processing Speed in Reading Speed Development. PLoS ONE 2013, 8(4):e58097.doi:10.1371/journal.pone.0058097.
Visual Count 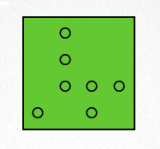 The term “visual count” refers to a basic visual capacity known as “subitizing” and “number counting” which are indicators of number concept.1 It is measured by flashing some small circles on a screen (at 100ms) and requires the observer to respond by indicating how many circles they have seen. The observer is encouraged to respond as quickly as they can since their response time is recorded. Smaller numbers of circles (1 to 4) will have a faster response time as they can be recognized straight away, however as the number of circles increases the observer has to think more about the number of items seen (as they count to themselves) which results in longer response times.
The ability of subitizing and visual counting has been shown to continue improving until around 17 years of age and is significantly affected in students with dyscalculia (difficulty with mathematical operations). In fact, about two thirds of students with dyscalculia have a problem with this basic visual task (irrespective of gender) regardless of whether the number of circles is high or low (ie. below 4 circles).2 The graph below shows the percentage of correct responses and the time it takes to respond (per/item) to enter the number the number of circles that are flashed on a screen.3
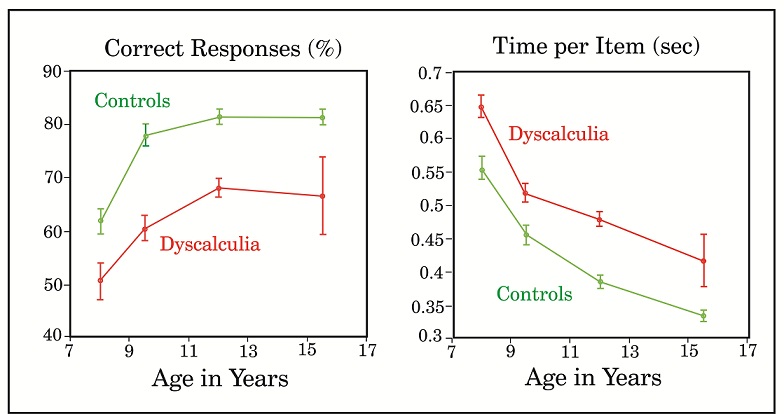 Ref: Optometry & Visual Development, 2008
A study was done by the Optomotor Brain Research Group at Freiburg University to find out if this skill can be improved with training.4 Their study involved around 74 students ages 7 to 13 years with poor basic arithmetic skills (as measured by the DEMAT) but normal reading and spelling. The training involved responding to a number of small circles (from 1 to 9) flashed randomly on the screen of a small hand held device. This took about 10 minutes a day over a period of 3 weeks. The response times were measured for 1-2 circles and also 4-8 circles (response time/item). In addition, the accuracy of the responses was measured for 4 to 8 circles and expressed as a percentage correct. The results of the training revealed significant improvements in both the reactions times and the percentage correct. The percentage of students who reached the normal range in BOTH variables was 85%.
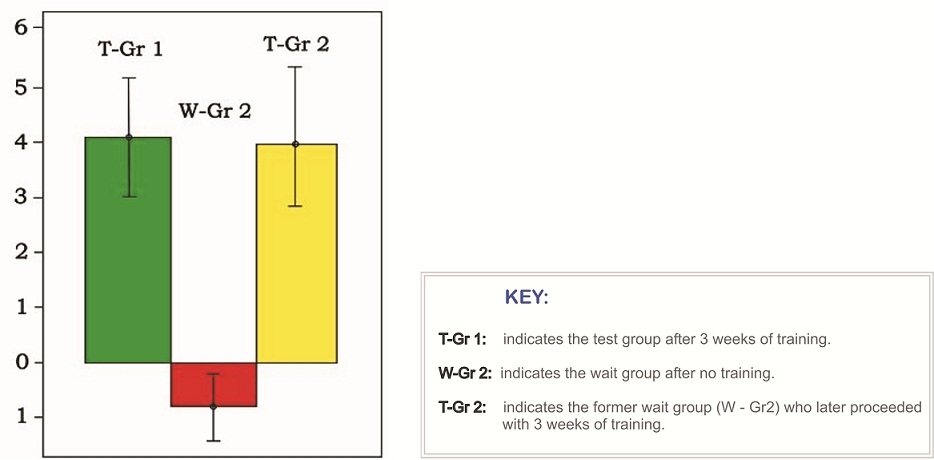
Transfer of this skill to basic arithmetic ability was measured by comparing pre-training scores with post-training scores on the DEMAT. This showed a considerable transfer effect after the training period (see graph below) which continued to increase even after a further period of time at school. Although a placebo was not included in this study it is unlikely the improvements were from other effects since not all domains in the DEMAT were affected by training. Furthermore, the visual capacity of subitizing and number counting are low-level visual functions that are probably not directly under the control of physiological factors.
REFERENCES
1. Koontz KL, Berch DB. Identifying simple numerical stimuli: processing inefficiencies exhibited by arithmetic learning disabled children. Mathematical Cognition 1996;2:1-24.
2. Landerl K, Bevan A, & Butterworth B. Developmental dyscalculia and basic numerical capacities” a study of 8-9 year old students. Cognition 2004;93:99-125.
3. Fischer B, Gebhardt C, Hartnegg K. Subitzing and visual counting in children with problems in acquiring basic arithmetic skills. Optometry & Vision Development 2008;39:24-29.
4. Fischer B, Kongeter A, Hartnegg K. Effects of daily practice on subitizing, visual counting and basic arithmetic skills. Optom Vis Dev 2008, 39(1):30-34.
Visual Spatial Visual spatial ability comprises a range of skill levels that start from basic laterality (an internal awareness of the left and right side), to directionality (an external awareness of the left and right side), through to higher cognitive processing that involves complex spatial analysis (eg. block rotations). The ability to perceive direction and make basic spatial judgements – such as staying on the line, making the correct spacing between letters and knowing ‘where I am’ on the page – is an extension of laterality. That is to say, “if I am not sure of my own left or right side, how can I be sure of the space in front of me?” It is not surprising therefore that many children who struggle with basic spatial concepts at school often confuse their left and right side. This is not the same as whether a child is left or right handed, which is referred to as “lateral preference”. Although one might expect these skills to be related the literature is still ambiguous on the relationship between eye/hand dominance and learning difficulties, with many investigators finding no relationship at all.1,2,3 This distinction between laterality and lateral preference was reported by Belmont & Birch as early as 1965, who found that eye/hand preference was not related to reading performance. At the same time, they found a significant relationship with right-left orientation, especially confusion of own body parts.4 Unfortunately, the topic of spatial awareness has not been given much attention compared with that of phonological awareness – the prevailing linguistic model for explaining learning disabilities. This may have led to the view that such approaches are contentious but one should not discard a view simply because of an imbalance in the literature. Despite this, the notion of a visual spatial deficit is starting to find support in recent literature.5-8
For example, a study involving 10 to 12 year old children that used the Clock Drawing Test (a medically recognized test of spatial awareness) found that students with dyslexia as well as garden variety learning problems frequently exhibit a spatial deficit (involving the right parietal cortex) compared with normal readers. That is to say, they tend to neglect the left side of space more often as shown by a gap in the picture of a clock they’ve been asked to draw (see below).9
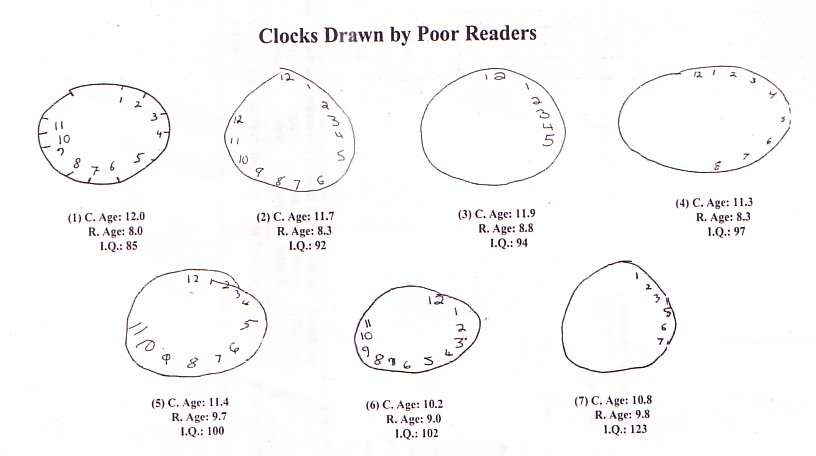 Ref: Journal of Learning Disabilities, 2003
An interesting point about this study is that the findings from the Clock Drawing Test (considered robust from age 8 years+) do not correlate well with those of the Block Design Test in the WISC-R for testing spatial reasoning. Because the Clock Drawing Test draws from memory it reveals something about the individual’s internal representation of space. In contrast, the Block Design Test draws on higher cognitive processing skills that do not rely as heavily on ones internal spatial organization.
In a series of studies by Winner et al (2001) it was shown that in most cases dyslexics were observed to be the same or worse on a broad range of visual spatial tasks except for one task (ie. the speed of recognition of “impossible figures”) where dyslexics were found to be faster but no more accurate than non-dyslexics. They make some suggestions as to why dyslexics might be over represented in professions that require spatial reasoning. This highlights the complexity of the visual spatial problem as well as the need to consider the broader developmental picture.
 An area that often arises around spatial awareness is that of letter reversals. From a developmental point of view it comes as no surprise to find that students with learning problems are more likely to make letter and number reversals11-14 as this is strongly dependent on directionality – especially letters such as ‘b’ and ‘d’. Of course there may well be other reasons for persistent letter reversals but if a child is making an abnormally high number of reversals then it is likely to be associated with an underlying spatial deficit. As with block rotations, student will eventually learn to overcome the problem of their letter reversals without treatment by using various compensations or linguistic mechanisms that provide phonological, semantic and syntactic cues but the underlying problem may still persist into adulthood.15
When children exhibit above normal reversals in association with observed spatial difficulties (ie. left-right confusion), there is an indication to commence spatial training. One approach is to link our perception of the direction of visual symbols with kinesthetic awareness (ie. left-right body awareness) in order to establish an internal, automatic awareness of left and right that does not depend on external cues. In younger children, this helps to provide a basis for directionality as well as for eye tracking and motor skills.


